Blog Post

Understanding The FTSE

Joe Hodgson • Sep 12, 2018

The FTSE 100 and FTSE 250; what are they, where did they come from and why do they matter?

Hi investors / soon-to-be investors,


For this blog post, I thought it would be good to continue on the theme of 'Understanding the [ insert market phase here ]'. We know that the information and media surrounding the stock market can often leave people feeling confused, what with all the buzz words and acronyms flying around.

We are here to provide you with a clearer understanding of how the market works, so that you can feel comfortable in getting your hard-earned cash working for you.

This week's topic:

The FTSE 100 and FTSE 250 ; what are they, where did they come from and why do they matter?

In order to determine the performance of a company's share price or an individual's share portfolio (the collection of shares an investor has), you must be able to measure its performance. This performance can be judged in relation to standardised market metrics, also known as 'Market Indices'.

A market index provides an investor context when reviewing the company he or she has invested in.

For example, if you have invested in 'Company X' and the share price falls by 3% over the course of a day, you would want to know whether this fall was an isolated incident for 'Company X', or whether a similar fall in share price was observed across the market.

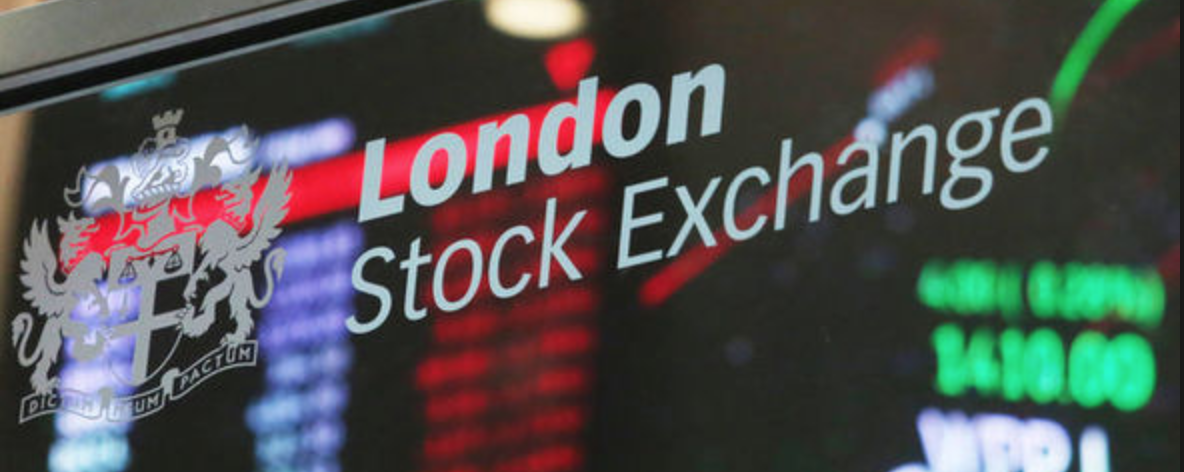
In 1984, the Financial Times ( FT ) agreed with the London Stock Exchange (L SE ) that the UK stock market needed a formalised set of market indices to help investors review their investments against 'market yardsticks'. This resulted in the birth of the FTSE (pronounced 'Footsie').

The two indices which are used most often to measure performance are the FTSE 100 and FTSE 250 .

FTSE 100

The basis of this index is the 100 largest and most valuable companies whose shares are listed on the LSE. The companies are all ranked in order of their market capitalisation (the market value of the company's outstanding shares, or share price multiplied by the number of outstanding shares). The FTSE 100 is often quoted as making up around 80% of the total market capitalisation of the LSE's main market.

The full list of companies that currently make up the FTSE 100 can be found here.

This list is reviewed quarterly, with some of the smaller companies (often ranked in 98th, 99th and 100th place) being replaced by companies from outside of the FTSE 100 . This is where the second market index comes in.

FTSE 250

As you may have guessed from the previous section, this index includes the 250 largest and most valuable companies outside of the FTSE 100 (positions 101st to 350th). The FTSE 250 represents around 15% of the total market capitalisation of the LSE's main market.

The full list of companies which currently make up the FTSE 250 can be found here.

To put these two indices into context, we can make a simple comparison to football (bear with me non-sports fans!).

In the UK, there are more than 7,000 football teams who play every week. Generally speaking, they are all ranked within their leagues depending on their performance and pedigree.

The largest, and most well-established teams play in the Premier League ( FTSE 100 ). The teams which are not quite good enough to belong in this elite group (though, still playing at an incredibly high standard) play in the Championship ( FTSE 250 ).

Every season, some teams are relegated from the Premier League and some teams are promoted from the Championship. This is similar to how companies can move from one market index to another.

Other Important Global Market Indices

Many stock market indices are calculated worldwide, and used to measure company share performance. Some of the main benchmarks can be found below, along with their country.


Index

Country

Dow Jones Industrial Average

United States

NASDAQ 100

United States

S&P 500

United States

Xetra DAX

Germany

CAC 40

France

Hang Seng

Hong Kong

Nikkei 225

Japan

Shanghai A

China

BSE Sensex

India

Bovespa

Brazil


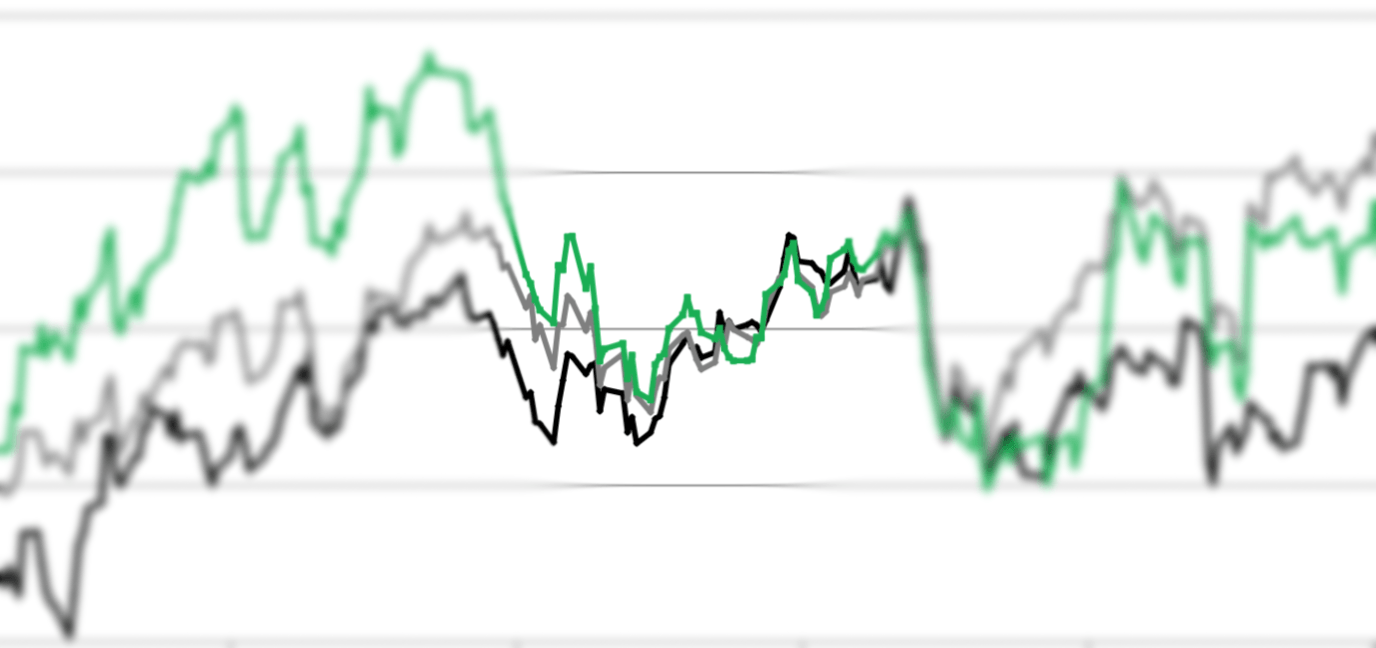
Our Monthly Stock Picks vs. the FTSE 100

Of our nine monthly stock picks selected so far in 2018, eight of the companies are currently listed in either the FTSE 100 (six) or the FTSE 250 (two).

In order to determine the performance of our monthly stock pick portfolio, we measure our monthly stock picks against the FTSE 100 which is displayed on 'The Graph'.

We'll select our October stock pick on the 1st October. If you're interested in finding out which company we'll be backing, sign up to our monthly stock picks now.

In summary, the FTSE indices are important for benchmarking your own portfolio performance. Remember, you can only manage what you can measure.


Happy investing!

Matt

Add your custom HTML here
is loading comments...
By Matt Streets 03 Jan, 2021
It will be the year that no one will ever forget, and the volatile nature of the COVID-19 pandemic took its toll on the UK stock market. Investors began to see the start of what was to come in late February, which culminated in the FTSE 100 suffering the second worst crash in a single day on 12th March 2020. After ‘bottoming out’ a couple of weeks later, the FTSE 100 had lost around a third of its value. It was clear that a significant change of fortune was required to breakeven for the year. The race was on to recover the losses to the Start Investing Stock Portfolio (SISP)
By Matt 25 Oct, 2020
We know that the stock market hasn’t been too kind to long-term value investors since March 2020 as a result of the COVID-19 pandemic. Plenty of portfolio positions around the world quickly when from being ‘ in the black ’ (profitable) to being ‘ in the red ’ (unprofitable).
By Joe Hodgson 26 Aug, 2020
Our stock pick last month Aggreko has performed well, earning 23% gains so far. Here is a short summary.
By Joe Hodgson 21 Jun, 2020
Hi investors, As many of our regular readers know, we follow the same routine at the end of each month in order to select our monthly stock pick. This routine can be broken down into 4 simple steps: Step 1 - High-Level Screening (Stocks analysed - 2750 ) We run a high-level screen for all companies available on the London Stock Exchange (LSE) using our list of key parameters ( you can read about these in our ebook ). Only around 3% of all stocks in the UK meet our strict criteria. Step 2 - IVI Evaluation (Stocks analysed - 50-80 ) We then assess each company using our Inherent Value Index (or IVI) evaluation method. This method takes into account key financial data, past and projected, and often removes a further 35-70 companies from the list. Step 3 - Stock Pick Selection (Stocks analysed - 10-15 ) At this point, we are left with fewer than 20 under-valued, dividend-paying companies (approximately 0.5% of the companies available on the LSE). From this list, we evaluate annual reports and company announcements to ensure that we have left no stone unturned before making our selection and circulating to our stock pick subscribers Step 4 - Investing (Stock selected - 1 ) Once the data analysis is complete, we wait for the first weekday of the month before investing our hard-earned cash into a company which we believe will stand us in good stead over the coming months and years. Simple but effective. Plus500 Ltd In the summer of 2019, after going through this rigorous analysis, we landed on a company called Plus500 Ltd (PLUS) as our July monthly stock pick. From our analysis, this international financial firm appeared to be trading at a heavily reduced share price of only £5.24 , having had a tough year in the market. Tighter regulations had meant a crack down in their industry, and many investors pulled out of the company believing it would not survi ve. However, our IVI method revealed a VERY strong set of financials and believed the market was wrong. Within 3 weeks, the stock price had risen by a whopping 25% which prompted Joe’s blog post in late July. Despite this short-term win , our analysis indicated that the company was still very much under-valued . As a consequence, at end of July 2019 we followed the numbers again and made a second investment into PLUS at a share price of £6.11 . For the rest of 2019, the share price continued to climb through £7.00 and £8.00, paying (literal) dividends along the way, until on the 4th March 2020, it had hit £9.57 per share. Then came Monday 9th March 2020: ‘ Black Monday ’. Global markets were turned on their heads as investors came to the realisation that the COVID-19 pandemic would disrupt life as we know it. As the share price fell to £7.31 on 16th March, we wondered whether we’d missed the boat to sell. Should we sell and take the profit now? Or should we hold and hope for a recovery? As ever, we looked at the numbers. After conducting further IVI analysis, we opted for the latter; at the current share price, the IVI method indicated that the company was still under-valued by the market. The share price duly bounced back towards the end of March and continued to rise throughout April. By 24th April 2020, the company was trading at over £12.50 per share. At this valuation, according to our calculations the company was moving from under-valued to a fair valuation status. This led us to asking 2 questions: 1. Do we trust in our IVI evaluation method and think that this company is no longer under-valued? YES 2. Would we be happy to take the profits gained so far to re-invest into other under-valued companies? YES It was time to sell . We sold our stake in PLUS at a share price of £12.51 . Overall, the numbers really speak for themselves when you work out the overall % profit over the 9-month period.
By Joe Hodgson 02 Jun, 2020
Missing data will result in a VALUE! or N/A error
By Joe Hodgson 02 Jun, 2020
1. Bellway PLC
By Joe Hodgson 10 May, 2020
Data visualisation housing stocks using radar chart FTSE 100
By Joe Hodgson 11 Mar, 2020
Hi investors, So, this Monday (9th March 2020, or ‘Black Monday’) investors across the world witnessed one of those sobering feelings as global stock markets turned uniformly red . Billions of dollar s were wiped off the face of the Earth by a swirling vortex of terror - one part unchecked spread of coronavirus , one part oil price war . Before 9am UK time on Monday, over £120bn was lost from the FTSE 100 alone , which closed down 7.2% . A drop like that in a single day hasn’t been recorded since the financial crash in 2008 . Interesting times lie ahead… However, do not lose hope ! People react irrationally during market downturns, and it is at times like these that investors need their decisions to be directed by their heads more than by their hearts . For example, we know that the companies which we invest in are good companies . Some are even g reat companies that have been around for decades, through several market crashes (and oil price wars )! And because of this, we will continue to invest regularly into the UK stock market as we strive towards financial freedom. Anecdotally, the stock market takes a downturn every 10 years . The last ‘crash' was in 2008, and we could be on the verge of the next blip. But as Warren Buffet would say: “Be fearful when others are greedy. Be greedy when others are fearful .” With this in mind, we spied an interesting exerpt from an Investors Chronicle (IC) supplement this week, which recommended ’10 Shares for Your ISA’ . Obviously, we couldn’t resist putting each company through our Inherent Value Index (IVI) evaluation to see whether any of these companies were good value investments . As outlined in our free ebook “The Start Investing Guide to Stock Screening” (which you can get for free by subscribing here ), we have certain metrics that we live by when it comes to picking stocks :
By Joe Hodgson 22 Feb, 2020
When we first started screening for stocks back in January 2018, the first few months produced surprising results: housing companies , seemingly making money hand over fist, were trading at a huge discount . At Start Investing we follow the numbers, and the numbers told us to cash in on these strong companies that had been beaten down by Brexit uncertainty. We continued to buy until early 2019, by that time housing stocks made up a large portion of our portfolio and even though we hadn't seen much of a return by then we trusted the strong financials these companies were reporting. Below is the result of our February 2019 screen, as you can see, 7 of the top 11 are housing companies : Bellway, Redrow, Bovis Homes, Countryside Properties, CRH, Taylor Wimpey and Persommon.
By Joe Hodgson 15 Jan, 2020
Hi investors, And just like that, it's been two years since the birth of the Start Investing Stock Portfolio (SISP). After buying into our first company on 19th December 2017, we've been regularly adding to the SISP on a monthly basis, and tracking the growth performance and incoming dividends. In this biennial review, we thought we'd share with you exactly how it has performed throughout 2018 and 2019. TL;DR Summary Over the last 2 years, our Monthly Stock Picks have outperformed the FTSE 100 by 13.2% and the FTSE 250 by 5.6% Dividend payments increased the growth of our portfolio by an additional 5.7% (not too long to read now, ey?!) As you will see, it really has been a journey of two halves... 2018 - Into the Deep End Total Number of Companies in Portfolio by 31st December 2018: 14 Best Performing Portfolio Stock of 2018: Rio Tinto PLC (RIO) +4.8% 2018 was a tough year for investors in the UK stock market, and the SISP was no exception. The poor performance over the 12-month period was ascribed to a combination of global volatility for equities and the uncertainty surrounding Brexit. Following a very positive start in January 2018, the SISP went on to perform similarly to the FTSE 100 Index over 12 months, both of which beat the FTSE 250 Index.
More Posts
Share by: