Why we bought in June 2021
Kingfisher, the second largest home improvement retailer in Europe, performed very
strongly over the first 12-18 months of the COVID-19 pandemic. People had been trapped inside their homes, working from their homes and trying to sell their homes, meaning home improvement projects have
skyrocketed.
Additionally, key Kingfisher stores such as B&Q and Screwfix were designated as ‘retailers of essential products’, and therefore could remain open at a time when any excuse to leave the house was gladly taken. As a result, Kingfisher had a very
profitable set of full year results in 2021.
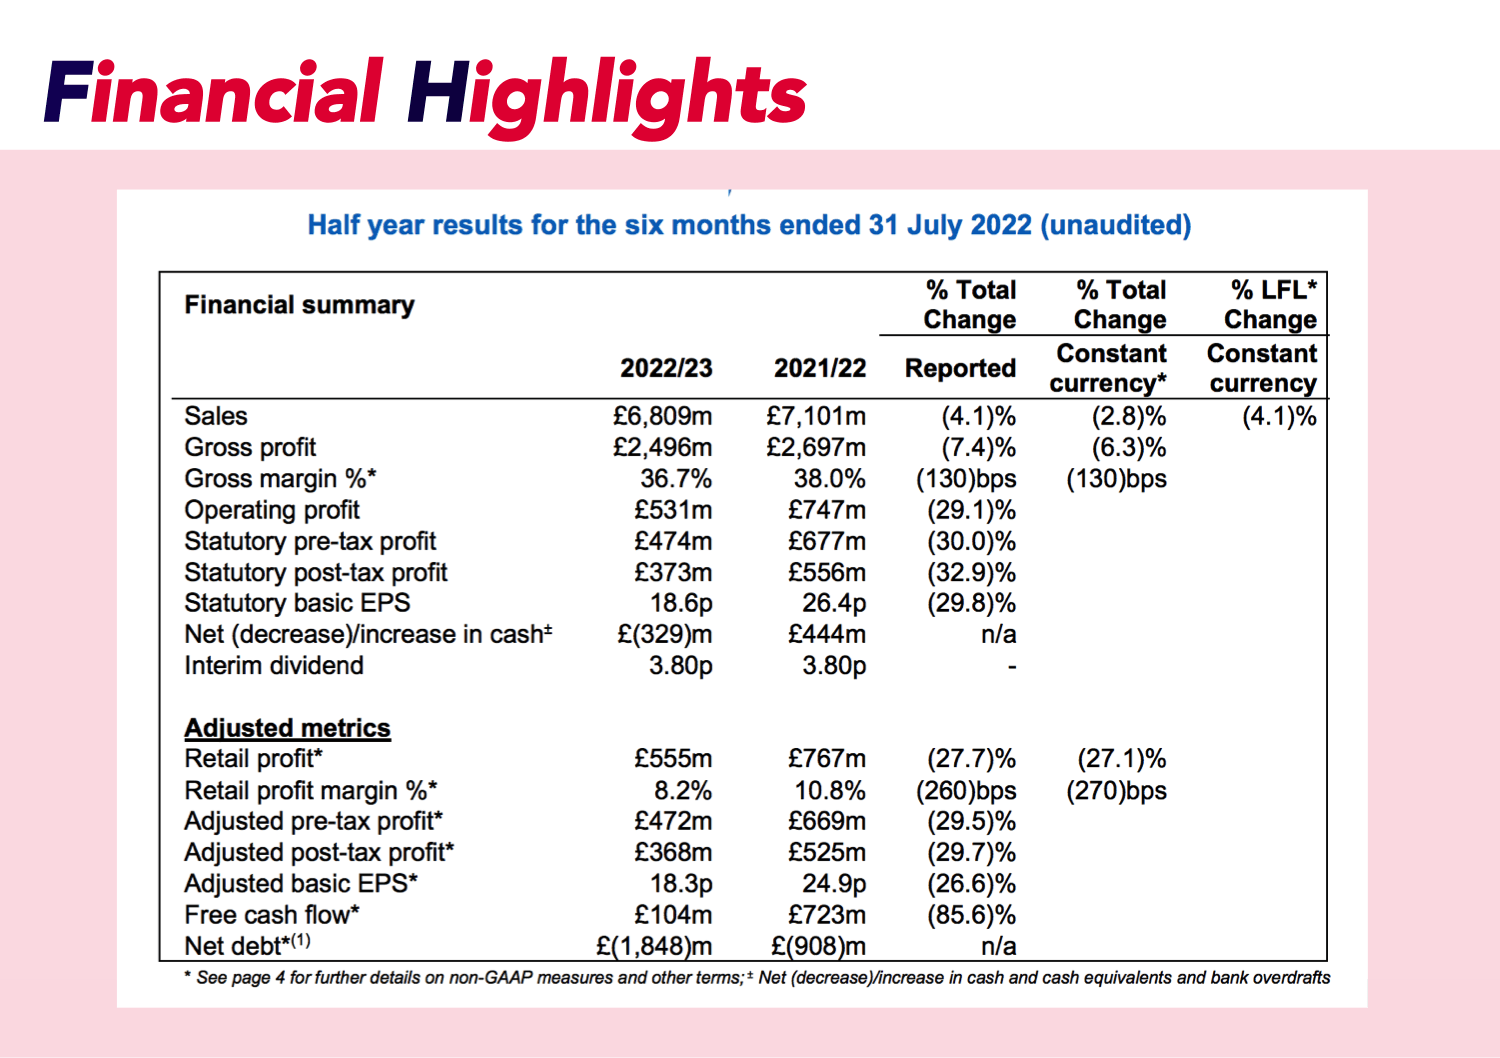
Since then, KGF's financial results have
dipped (with sales down by
4.1% according to the
H1 report) against a
very high comparative year, but have been in line with the company's forecast following the end of the restrictions. However, the 3-year like-for-like results make for very
encouraging reading, with double-digit
growth in many key areas. In contrast, the share price has tumbled by around
40%, leaving the overall picture looking more attractive from a value-investing standpoint. As you can see from the above RADAR chart, several of the ratios we use to value companies have actually
improved.
Snapshot of the H2 outlook
- KGF sales are significantly ahead of pre-pandemic levels (3-year LFL sales
+16.6%), and are expected to remain strong for the second half of the year.
- The outlook for the rest of the year shows Q3 22/23 like-for-like sales (to 17 September 2022) up
15.2% on a 3-year basis, with 1-year LFL down 0.7%
- H1 performance and current trading in Q3 consistent with FY 22/23 adjusted pre-tax profit guidance of
c.£770m, as set out at the start of this year
- The KGF dividend yield is now at a very healthy
5.75%
- Employees at KGF are confident in the future of the company, with insiders purchasing
£775,000
worth of stock so far this year.
Conclusion
The DIY boom appears to be over for the time being and KGF have
failed to achieve results as good as those driven by the pandemic in 2020. However, the bigger picture is that Kingfisher are
growing in many key areas, and with
80 more stores set to open this year in new areas across Europe, the company looks in a
good position in the long-term.
It looks as though the economic situation in the UK is going to have wide-ranging effects for almost every UK business, and KGF will not be
immune to these challenges. Our instinct is that the UK market is likely to get
worse before it gets
better. However, as we have said in the past, it is important to take advantage of
over-corrections in the market, and to snap up
strong, profitable companies when these downturns arise. Luckily, we have been through financial crashes before, and each time they occur we have been brave enough to see them as an
opportunities, not as threats.
We will be
adding to our position in KGF when the market opens tomorrow morning.
Snapshot of the H2 outlook
- KGF sales are significantly ahead of pre-pandemic levels (3-year LFL sales +16.6%), and are expected to remain strong for the second half of the year.
- The outlook for the rest of the year shows Q3 22/23 like-for-like sales (to 17 September 2022) up 15.2% on a 3-year basis, with 1-year LFL down 0.7%
- H1 performance and current trading in Q3 consistent with FY 22/23 adjusted pre-tax profit guidance of c.£770m, as set out at the start of this year
- The KGF dividend yield is now at a very healthy 5.75%
- Employees at KGF are confident in the future of the company, with insiders purchasing £775,000 worth of stock so far this year.
| Month | Company | Ticker Symbol | Purchase Date | Current Stock Price (p) | Dividend Yield To Date (%) | Amount Re-invested (£) | Regular Monthly Investment (£) | Purchase Price (p) | Sold? | Dividend Income (£) |
|---|---|---|---|---|---|---|---|---|---|---|
| February 2021 | Hikma Pharmaceuticals PLC | HIK | 01/02/21 | 1363.50 | 2.66% | £0.00 | £1,657.54 | 2408.97 | No | £44.01 |
| March 2021 | Sylvania Platinum Ltd | SLP | 01/03/21 | 87.00 | 8.17% | £0.00 | £1,077.77 | 120.85 | No | £88.01 |
| April 2021 | Plus500 Ltd | PLUS | 06/04/21 | 1685.07 | 2.46% | £0.00 | £1,717.48 | 1438.50 | No | £90.81 |
| May 2021 | Capital Drilling Ltd | CAPD | 04/05/21 | 83.00 | 4.10% | £0.00 | £1,587.89 | 69.00 | No | £65.05 |
| June 2021 | Kingfisher PLC | KGF | 01/06/21 | 220.40 | 5.86% | £0.00 | £1,254.37 | 337.00 | No | £73,53 |
| July 2021 | Ultra Electronics Holdings PLC | ULE | 05/07/21 | 3216.87 | 0.68% | £0.00 | £1,423.50 | 2327.08 | Yes | £9.72 |
| August 2021 | H&T Group PLC | HAT | 02/08/21 | 337.50 | 1.44% | £0.00 | £355.53 | 278.20 | Yes | £5.11 |
| September 2021 | Rio Tinto PLC | RIO | 06/09/21 | 4910.50 | 6.44% | £0.00 | £1,804.58 | 5414.00 | No | £116.26 |
| October 2021 | Redrow PLC | RDW | 04/10/21 | 399.20 | 3.94% | £0.00 | £884.27 | 655.73 | No | £34.83 |
| November 2021 | Cranswick PLC | CWK | 01/11/21 | 2680.00 | 0.57% | £0.00 | £1,676.78 | 3453.00 | No | £36.10 |
| December 2021 | BAE Systems PLC | BA | 06/12/21 | 1363.50 | 2.70% | £0.00 | £2,643.10 | 554.00 | Yes | £71.43 |
| January 2022 | Jersey Electricity PLC | JEL | 04/01/22 | 1703.00 | 2.83% | £0.00 | £2,096.48 | 627.00 | No | £59.28 |
| February 2022 | Hikma Pharmaceuticals PLC | HIK | 01/02/22 | 196.80 | 1.31% | £0.00 | £2,019.97 | 2064.00 | No | £26.52 |
| March 2022 | Bellway PLC | BWY | 01/03/22 | 206.80 | 0.00% | £1,923.92 | £1,141.81 | 2885.90 | No | 85.73 |
| April 2022 | Tyman PLC | TYMN | 04/04/22 | 399.20 | 2.74% | £423.63 | £2,515.61 | 320.00 | No | 80.53 |
| May 2022 | Tesco PLC | TSCO | 03/05/22 | 4910.50 | 4.54% | £848.76 | £3,527.96 | 273.14 | No | 198.53 |
| June 2022 | Redrow PLC | RDW | 06/06/22 | 264.00 | 0.00% | £0.00 | £1,718.37 | 517.00 | No | 0 |
| July 2022 | Rio Tinto | RIO | 04/07/22 | 83.00 | 0.00% | £0.00 | £1,668.17 | 4830.00 | No | 0 |
| August 2022 | Pets at Home PLC | PETS | 08/08/22 | 309.40 | 0.00% | £2,026.25 | £1,300.73 | 332.70 | No | 0 |
| September 2022 | Capital Drilling Ltd | CAPD | 05/09/22 | 83.00 | 0.00% | £0.00 | £449.79 | 86.20 | No |
This is our portfolio tracking table, which we will update every month on this page.
If you haven't already, you can download the 'smart'
version of this table on which you can fill out and track your own returns, click the button below.
All you need to do is copy the row for this month's pick and paste it into your table. Then enter your own values in the cells:
Amount Re-invested
(which will be 0 for the first year)
Regular Monthly Investment
(the amount you have invested in £)
Purchase Price
(the cost of 1 share of the stock you have bought in pence)
The rest of the table will be taken care of by our
'smart' formulae.
Download Smart Returns Tracker
This is our portfolio tracking table, which we will update every month on this page.
If you haven't already, you can download the 'smart'
version of this table on which you can fill out and track your own returns, click the button below.
All you need to do is copy the row for this month's pick and paste it into your table. Then enter your own values in the cells:
Amount Re-invested
(which will be 0 for the first year)
Regular Monthly Investment
(the amount you have invested in £)
Purchase Price
(the cost of 1 share of the stock you have bought in pence)
The rest of the table will be taken care of by our
'smart' formulae.