The August 2018 Stock Pick: A Case Study
Joe Hodgson • August 20, 2018

Hey investors,
With our website launching this month, I wanted to write a post about the step-by-step method we use for choosing stocks and how we came to pick our stock for August.
With our website launching this month, I wanted to write a post about the step-by-step method we use for choosing stocks and how we came to pick our stock for August.
It has generally been a slow couple of months in the UK market, with tasty dollops of Brexit rumour and a light sprinkle of Trump trade standoff, bargains are not hard to find.
As we talk about in our website www.startinvestinguk.com
we rank every company in the FTSE 100 and 250 to find the top 20 most undervalued stocks in the UK market for the month. This means we look at hundreds of financial reports and input the data into our ranking system EVERY MONTH. That gives us the data we need to get the most complete assessment of a company we can from a numbers perspective.
What data do we use?
There are a lot of ratios used in investing, that is because they give you information in a way that means you can easily compare companies of vastly different sizes. If you only look at a company’s revenue, let’s say Tesco, they had a revenue of 55 billion in 2017. Sounds good, but it doesn’t really tell us anything tangible about the company. Is that a good number relative to its share price? Is the revenue up from last year? What about debt levels? Numbers by themselves aren’t particularly useful so we combine them to make them more relevant.
Here are a couple of examples of the many ratios we include in our ranking method.
1, P/E ratio –
Price/Earnings; the headliner, the stalwart, the undisputed heavyweight champion of the value investing world. It is the company’s share price in relation to their earnings per share for that year.
Say there are 2 chickens for sale on the market, one with a P/E of 10, one with a P/E of 100.
If you pay 10 eggs for a chicken with a P/E ratio of 10, you would expect that chicken to be making you 1 egg per year in return.
However, in order to get your 1 egg back from the chicken with of P/E of 100 (looking at you Amazon), you would have to pay 100 eggs.
In very basic terms, low P/E is better for value investing, we aim for less than 25. BUT a company’s P/E can get too low, if it gets down around the 5-6 mark or lower, it’s usually a sign that something is wrong.
2, D/E ratio -
Debt/Equity: this ratio shows how much debt a company has relative to its shareholder’s equity. It is shown as either a percentage or a decimal. A company with £100 in shareholders equity and £50 of debt would have a D/E ratio of 50% or 0.5.
What it really shows is how much a company is relying on money that it had to borrow to keep running. We start to get a little uneasy with a D/E of around 100%. If profits take a hit in that situation, debt repayments can stack up and companies can get into a sticky situation. Not good for its shareholders. By the way, if a company goes bust, who do you think gets paid first? The shareholders, or their debt obligations? Sadly for us it is the debt that is paid first and the shareholders last (or sometimes not at all!) so we take high debt levels very seriously at SI.
Financial institutions such as banks and insurance companies tend to have a lot of debt because of how they operate, so it is not unusual to see very high D/E ratios. For example HSBC currently has a D/E of 122%. Many investors don’t see this as a problem but it still makes us nervous, especially given what happened in 2008! So we tend to be extra careful when investing in financial companies.
3, Dividend Yield -
This is the amount a company pays out each year in dividends relative to its share price. For example, if one share of Tesco costs £2, and their dividend yield is 1%, they will pay you 2p per year in dividends.
In the long term, dividend paying stocks are the ones that are going to pay us our salary. Let’s say you manage to make a million pounds in savings by the time you’re 60. That sounds like loads right? You can do whatever you want! Well maybe not, let’s say you live until you’re 90. 1 million pounds becomes £33,333 pounds per year over 30 years, and with inflation increasing every year, that might not be enough to live the life you want. Ok, now let’s say you have 1 million pounds in stocks paying a 6% dividend yield. That means you get £60,000 per year from your stocks, and don’t forget the market increases by an average of 9% per year without dividends. So you get your salary and the money in your stocks increases every year! This is the ultimate goal, and this is why we always pick stocks that pay a dividend.
In the long term, dividend paying stocks are the ones that are going to pay us our salary. Let’s say you manage to make a million pounds in savings by the time you’re 60. That sounds like loads right? You can do whatever you want! Well maybe not, let’s say you live until you’re 90. 1 million pounds becomes £33,333 pounds per year over 30 years, and with inflation increasing every year, that might not be enough to live the life you want. Ok, now let’s say you have 1 million pounds in stocks paying a 6% dividend yield. That means you get £60,000 per year from your stocks, and don’t forget the market increases by an average of 9% per year without dividends. So you get your salary and the money in your stocks increases every year! This is the ultimate goal, and this is why we always pick stocks that pay a dividend.
We aim for >3% yield but we will make exceptions for the occasional company, especially if they have been increasing their dividends year on year.
There are many more metrics that we use to pick stocks, but in the interest of keeping this post short ish
I will move on to our August stock pick.
August Pick
Pets at Home
The stock we ended up choosing hasn’t been on our radar much in the last few months, it is a good company but it has been relatively fairly valued. The share price has been steadily decreasing and despite its strong overall numbers it started to look undervalued.
It first appeared in our top 20 undervalued stocks at the beginning of July and its price continued to drop until it was a mouth watering prospect.
Let’s have a look at some of ratios that we looked at above for Pets at Home just before we bought it on the 1st August.
P/E ratio - 8.8
D/E ratio - 21.46%
Dividend Yeild - 6.42%
These are some excellent figures, and to be honest it looked good on all of our metrics. The market has decided to bash Pets at Home down due to increased competition, but from our analysis we thought that the stock price was low.
With a high dividend yeild as well, this makes PAH a good long term prospect
So we decided to purchase the stock on the 1st August and recommend it as our monthly pick.
You can see a video of the step-by-step buying process here where we buy Pets at Home on the trading platform Interactive Investor:
Nine days after the recommendation the stock increased in value by 10%.
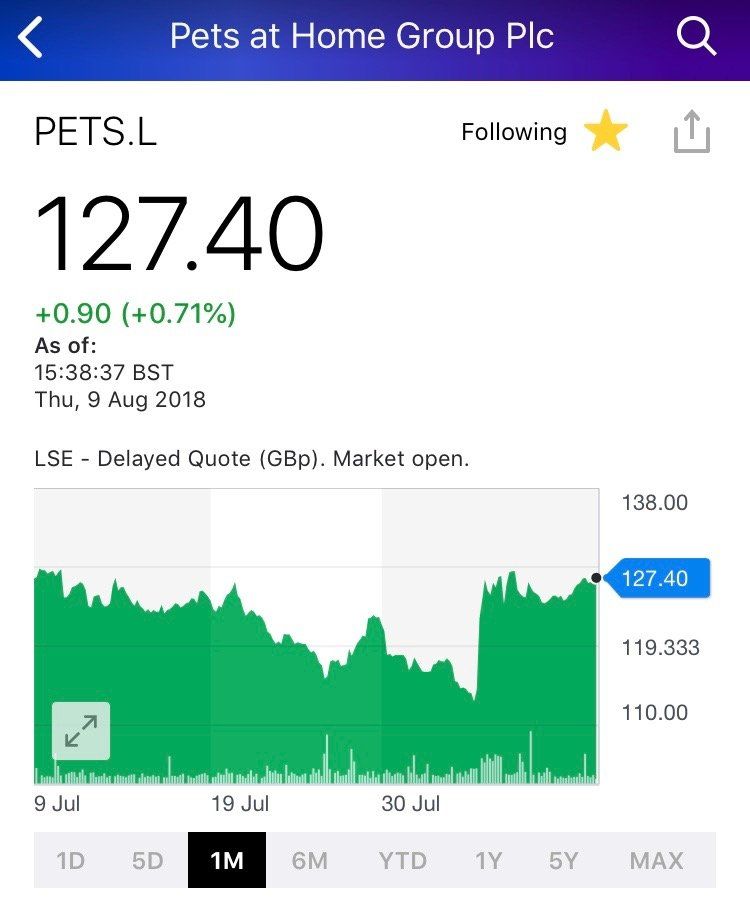
Source: Yahoo Finance
Now we could sell our stock with a tidy profit but history tells us that that the real gains come over the very long term. We’ve bought a great business at a bargain price, now we sit back and watch those dividends roll in year after year and let compound interest work it’s magic. Unless something happens to make us sell this stock (the stock price lowering is NOT
one of those things), we will keep this stock for the next 20-30 years. To find out what makes us want to sell one of our carefully chosen stocks, see our website!
If you want to follow our portfolio and get in BEFORE the price starts going up, sign up to our stock picking service at:
Sign up before August 28th to get September’s pick!
Thanks so much for reading!
Joe
PS. We don't want to see anyone getting into financial difficulties, so never invest money you can't afford to lose, stock prices can decrease. We are not intending to be a substitute for professional financial advice, so if you're not sure if stocks are right for you, please seek professional guidance.

It will be the year that no one will ever forget, and the volatile nature of the COVID-19 pandemic took its toll on the UK stock market. Investors began to see the start of what was to come in late February, which culminated in the FTSE 100 suffering the second worst crash in a single day on 12th March 2020. After ‘bottoming out’ a couple of weeks later, the FTSE 100 had lost around a third of its value. It was clear that a significant change of fortune was required to breakeven for the year. The race was on to recover the losses to the Start Investing Stock Portfolio (SISP)

We know that the stock market hasn’t been too kind to long-term value investors since March 2020 as a result of the COVID-19 pandemic. Plenty of portfolio positions around the world quickly when from being ‘ in the black ’ (profitable) to being ‘ in the red ’ (unprofitable).

Our stock pick last month Aggreko has performed well, earning 23% gains so far. Here is a short summary.

Hi investors, As many of our regular readers know, we follow the same routine at the end of each month in order to select our monthly stock pick. This routine can be broken down into 4 simple steps: Step 1 - High-Level Screening (Stocks analysed - 2750 ) We run a high-level screen for all companies available on the London Stock Exchange (LSE) using our list of key parameters ( you can read about these in our ebook ). Only around 3% of all stocks in the UK meet our strict criteria. Step 2 - IVI Evaluation (Stocks analysed - 50-80 ) We then assess each company using our Inherent Value Index (or IVI) evaluation method. This method takes into account key financial data, past and projected, and often removes a further 35-70 companies from the list. Step 3 - Stock Pick Selection (Stocks analysed - 10-15 ) At this point, we are left with fewer than 20 under-valued, dividend-paying companies (approximately 0.5% of the companies available on the LSE). From this list, we evaluate annual reports and company announcements to ensure that we have left no stone unturned before making our selection and circulating to our stock pick subscribers Step 4 - Investing (Stock selected - 1 ) Once the data analysis is complete, we wait for the first weekday of the month before investing our hard-earned cash into a company which we believe will stand us in good stead over the coming months and years. Simple but effective. Plus500 Ltd In the summer of 2019, after going through this rigorous analysis, we landed on a company called Plus500 Ltd (PLUS) as our July monthly stock pick. From our analysis, this international financial firm appeared to be trading at a heavily reduced share price of only £5.24 , having had a tough year in the market. Tighter regulations had meant a crack down in their industry, and many investors pulled out of the company believing it would not survi ve. However, our IVI method revealed a VERY strong set of financials and believed the market was wrong. Within 3 weeks, the stock price had risen by a whopping 25% which prompted Joe’s blog post in late July. Despite this short-term win , our analysis indicated that the company was still very much under-valued . As a consequence, at end of July 2019 we followed the numbers again and made a second investment into PLUS at a share price of £6.11 . For the rest of 2019, the share price continued to climb through £7.00 and £8.00, paying (literal) dividends along the way, until on the 4th March 2020, it had hit £9.57 per share. Then came Monday 9th March 2020: ‘ Black Monday ’. Global markets were turned on their heads as investors came to the realisation that the COVID-19 pandemic would disrupt life as we know it. As the share price fell to £7.31 on 16th March, we wondered whether we’d missed the boat to sell. Should we sell and take the profit now? Or should we hold and hope for a recovery? As ever, we looked at the numbers. After conducting further IVI analysis, we opted for the latter; at the current share price, the IVI method indicated that the company was still under-valued by the market. The share price duly bounced back towards the end of March and continued to rise throughout April. By 24th April 2020, the company was trading at over £12.50 per share. At this valuation, according to our calculations the company was moving from under-valued to a fair valuation status. This led us to asking 2 questions: 1. Do we trust in our IVI evaluation method and think that this company is no longer under-valued? YES 2. Would we be happy to take the profits gained so far to re-invest into other under-valued companies? YES It was time to sell . We sold our stake in PLUS at a share price of £12.51 . Overall, the numbers really speak for themselves when you work out the overall % profit over the 9-month period.


Data visualisation housing stocks using radar chart FTSE 100

Hi investors, So, this Monday (9th March 2020, or ‘Black Monday’) investors across the world witnessed one of those sobering feelings as global stock markets turned uniformly red . Billions of dollar s were wiped off the face of the Earth by a swirling vortex of terror - one part unchecked spread of coronavirus , one part oil price war . Before 9am UK time on Monday, over £120bn was lost from the FTSE 100 alone , which closed down 7.2% . A drop like that in a single day hasn’t been recorded since the financial crash in 2008 . Interesting times lie ahead… However, do not lose hope ! People react irrationally during market downturns, and it is at times like these that investors need their decisions to be directed by their heads more than by their hearts . For example, we know that the companies which we invest in are good companies . Some are even g reat companies that have been around for decades, through several market crashes (and oil price wars )! And because of this, we will continue to invest regularly into the UK stock market as we strive towards financial freedom. Anecdotally, the stock market takes a downturn every 10 years . The last ‘crash' was in 2008, and we could be on the verge of the next blip. But as Warren Buffet would say: “Be fearful when others are greedy. Be greedy when others are fearful .” With this in mind, we spied an interesting exerpt from an Investors Chronicle (IC) supplement this week, which recommended ’10 Shares for Your ISA’ . Obviously, we couldn’t resist putting each company through our Inherent Value Index (IVI) evaluation to see whether any of these companies were good value investments . As outlined in our free ebook “The Start Investing Guide to Stock Screening” (which you can get for free by subscribing here ), we have certain metrics that we live by when it comes to picking stocks :

When we first started screening for stocks back in January 2018, the first few months produced surprising results: housing companies , seemingly making money hand over fist, were trading at a huge discount . At Start Investing we follow the numbers, and the numbers told us to cash in on these strong companies that had been beaten down by Brexit uncertainty. We continued to buy until early 2019, by that time housing stocks made up a large portion of our portfolio and even though we hadn't seen much of a return by then we trusted the strong financials these companies were reporting. Below is the result of our February 2019 screen, as you can see, 7 of the top 11 are housing companies : Bellway, Redrow, Bovis Homes, Countryside Properties, CRH, Taylor Wimpey and Persommon.
Hi investors, And just like that, it's been two years since the birth of the Start Investing Stock Portfolio (SISP). After buying into our first company on 19th December 2017, we've been regularly adding to the SISP on a monthly basis, and tracking the growth performance and incoming dividends. In this biennial review, we thought we'd share with you exactly how it has performed throughout 2018 and 2019. TL;DR Summary Over the last 2 years, our Monthly Stock Picks have outperformed the FTSE 100 by 13.2% and the FTSE 250 by 5.6% Dividend payments increased the growth of our portfolio by an additional 5.7% (not too long to read now, ey?!) As you will see, it really has been a journey of two halves... 2018 - Into the Deep End Total Number of Companies in Portfolio by 31st December 2018: 14 Best Performing Portfolio Stock of 2018: Rio Tinto PLC (RIO) +4.8% 2018 was a tough year for investors in the UK stock market, and the SISP was no exception. The poor performance over the 12-month period was ascribed to a combination of global volatility for equities and the uncertainty surrounding Brexit. Following a very positive start in January 2018, the SISP went on to perform similarly to the FTSE 100 Index over 12 months, both of which beat the FTSE 250 Index.