
A solid, steady compounder in UK mortgage lending
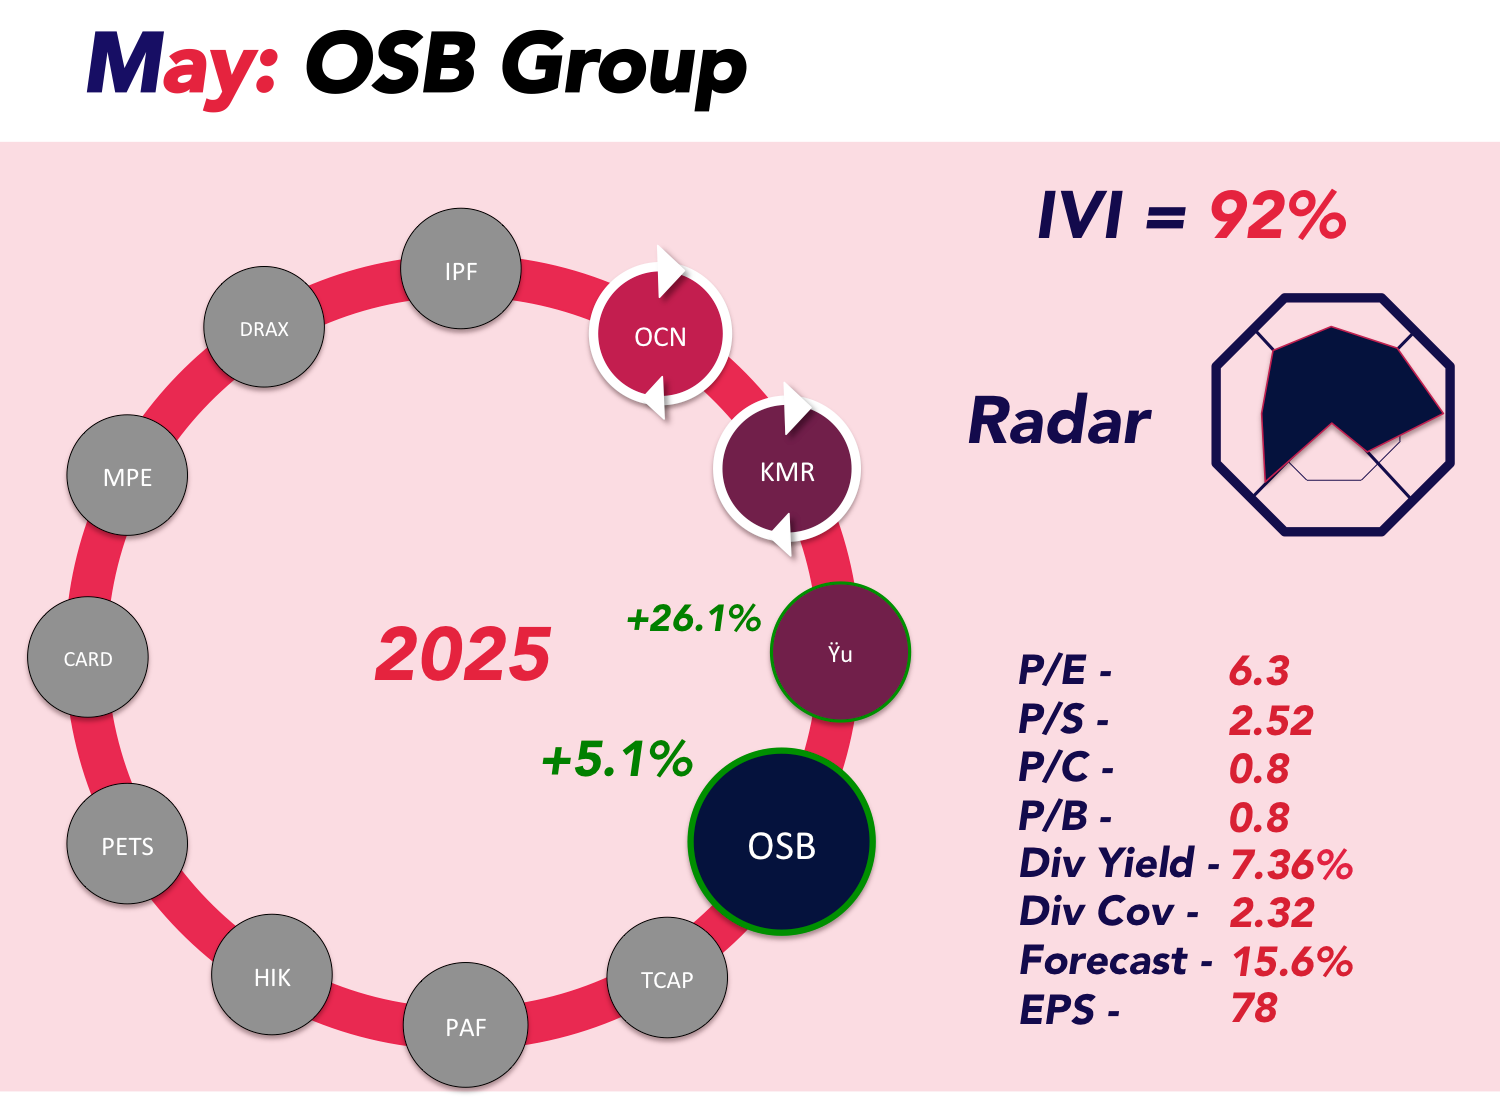
This month, we’re adding OSB Group PLC (LSE: OSB) to the portfolio — a specialist lender with a clear focus on what it does best: buy-to-let and complex mortgages, backed by a strong base of retail savers. It’s not the flashiest business, but with robust profitability, cautious risk management, and a chunky dividend, OSB ticks a lot of the boxes we look for at The Compounding Club.
What does OSB do?
OSB Group is a specialist mortgage lender and retail savings provider. Through its two core franchises — Kent Reliance and Charter Savings Bank — it serves a wide range of property investors, homeowners, and developers with:
- Buy-to-let and commercial mortgages
- Residential and second-charge loans
- Bridging, development and asset finance
Its customers tend to be more complex than what you’d find at a high street bank, which gives OSB the chance to earn higher margins — if it gets the risk management right. And so far, it has.
How did OSB perform in the last 12 months?
Despite a tricky environment for mortgage lending, OSB delivered a resilient set of results for 2024:
- Underlying profit before tax rose 4% to £442 million
- Statutory profit before tax up 12% to £418 million
- Return on tangible equity (RoTE) in the low-teens
- CET1 ratio (a key safety buffer) strong at 16.1%
A few metrics — like the loan book and net interest margin — edged lower, largely due to a December securitisation and tighter mortgage spreads. But importantly, loan losses fell and credit quality remains strong.
Key things we like:
- Low valuation: OSB trades on a price-to-earnings (P/E) ratio of under 6x and at a discount to tangible net assets — rare for a consistently profitable lender.
- Shareholder-friendly: A new £100 million share buyback is under way, reflecting confidence in the business and supporting shareholder returns.
- Solid capital and funding: OSB is mainly funded by £24 billion in retail deposits, which tend to be more stable than wholesale sources.
- Clean balance sheet: With £2.2 billion in tangible equity, OSB has the financial strength to weather bumps in the market.
A few risks to keep in mind
- Heavy reliance on retail deposits: Most of OSB’s funding comes from UK savers. If competition for deposits heats up, it could impact margins.
- Buy-to-let market pressures: Rising regulation and changing tax rules could affect landlords — and, by extension, OSB’s core customer base.
Still, we think these risks are more than priced in at the current valuation.
What’s next for OSB?
OSB is now in year two of a five-year transformation programme, focusing on tech improvements and customer experience. The first quarter of 2025 was steady, and management reaffirmed full-year guidance:
- Net interest margin around 2.25%
- Loan book growth in the low single digits
- Low-teens return on equity
It’s not aiming for explosive growth — and that’s fine. With returns like this, priced this cheaply, OSB doesn’t need to shoot the lights out to be a rewarding long-term hold.
Our take
OSB Group is a well-run, conservatively managed lender trading at a fair price. It offers reliable cash generation, strong shareholder returns, and a niche strategy that continues to deliver. It may not be exciting — but we think it’s exactly the kind of business that belongs in a compounding portfolio.