December 2024

Drax Group PLC (ticker: DRX) is a UK-based renewable energy leader focusing on biomass power generation, flexible electricity supply, and carbon capture innovation.

Its operations span Pellet Production (sustainably sourced biomass), Biomass Generation (24/7 renewable power at Drax Power Station in Yorkshire), and Flexible Generation (pumped storage hydro and gas turbines). The company also pioneers Bioenergy with Carbon Capture and Storage (BECCS), aiming for net-negative emissions while supporting the UK’s clean energy goals.

Drax plays a vital role in energy security and the transition to net-zero through its diversified renewable solutions and innovative carbon-removal projects.


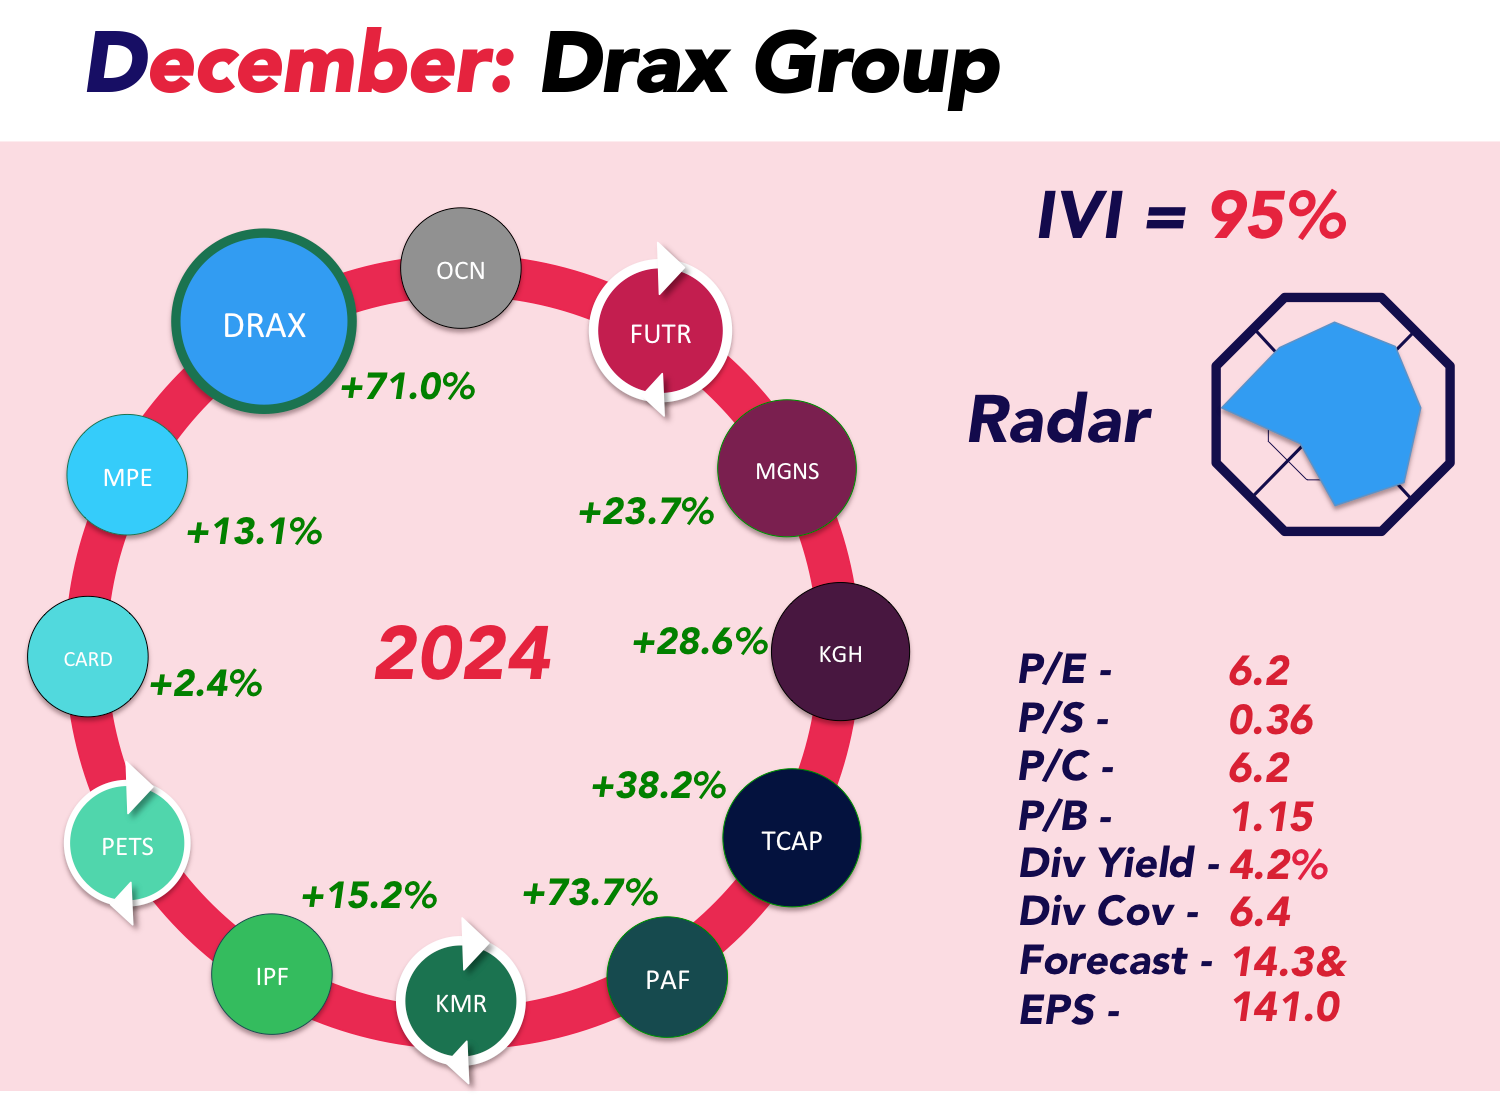
Is Drax set to light up the renewable energy market?

Drax Group (LSE: DRX) is a renewable energy leader, driving innovation in biomass power, flexible generation, and carbon capture technologies. With robust operational performance and ambitious future targets, Drax offers compelling reasons for long-term investors to take note.

The Case for Drax
1. Stable Performance and Growing Profitability
Drax continues to deliver strong financial results. Its 2024 adjusted EBITDA is expected to hit the top of analyst estimates, approaching £1.04 billion​. The group’s cost management and high-margin revenue streams from contracted power sales (£3.2 billion between 2024–2026) further underscore its financial stability​

2. Key Role in the UK's Energy Transition
Drax plays a pivotal role in meeting the UK’s 2030 clean energy goals. The National Energy System Operator (NESO) highlights biomass and carbon capture as essential for decarbonizing the power grid, areas where Drax excels​.

3. Growth Potential in Carbon Capture and Global Markets
Drax’s investment in Bioenergy with Carbon Capture and Storage (BECCS) positions it at the forefront of the emerging carbon removal market. Its newly launched US-based Elimini business is tapping into global opportunities for 24/7 renewable power and high-integrity carbon removals—a potentially transformative growth driver​.

4. Disciplined Capital Allocation and Shareholder Returns
Drax is executing a £300 million share buyback program, signaling confidence in its financial health. The company has also strengthened its balance sheet, reducing gross debt by £200 million and targeting net debt of 1x EBITDA by year-end​.

5. Aligned with Long-Term Sustainability Trends
With increasing demand for renewable energy, sustainable aviation fuel (SAF), and flexible generation, Drax is well-positioned to capture long-term value. The company's innovation, such as wind-assisted shipping trials for biomass transport, highlights its commitment to sustainability and cost efficiency​.

Risks to Consider
Drax’s future investments in BECCS and biomass depend on supportive UK government policies, particularly post-2027 frameworks. Delays in regulatory clarity could impact its growth trajectory​


Conclusion
Drax Group offers a unique blend of stable cash flows, growth opportunities in renewable energy, and a strong commitment to shareholder returns. As the world transitions to a cleaner energy future, Drax’s leadership in biomass and carbon capture technologies positions it as a long-term winner. For investors seeking exposure to the renewable energy space, Drax is a standout candidate.


We will be adding it to our portfolio on Monday. 

RETURNS TABLE  

Month Company Ticker Symbol Purchase Date Current Stock Price (p) Dividend Yield To Date (%) Re-Invested (£) Regular Monthly Investment (£) Purchase Price (p) Sold? Dividend Income (£) Growth with Dividends Growth without Dividends
February 2023 Cranswick PLC CWK 06/02/23 3569.00 1.79% £0.00 £2,118.78 3082.00 Yes £37.93 17.6% 15.8%
March 2023 Avingtrans PLC AVG 06/03/23 387.50 1.02% £0.00 £2,805.08 435.00 No £28.71 -9.9% -10.9%
April 2023 Vesuvius PLC VSVS 03/04/23 472.83 5.48% £0.00 £1,465.86 410.00 Yes £80.35 20.8% 15.3%
May 2023 Tyman PLC TYMN 02/05/23 296.00 1.73% £0.00 £1,212.35 249.19 No £20.96 20.5% 18.8%
June 2023 PayPoint PLC PAY 05/06/23 541.75 6.67% £0.00 £1,460.29 407.14 Yes £97.42 39.7% 33.1%
July 2023 Pan African Resources PLC PAF 03/07/23 22.35 2.57% £0.00 £1,255.45 12.88 No £32.23 76.1% 73.5%
August 2023 Hikma Pharmaceuticals PLC HIK 01/08/23 1863.00 0.00% £0.00 £879.21 2089.00 No £0.00 -10.8% -10.8%
September 2023 Castings PLC CGS 04/09/23 329.00 1.20% £6,268.97 £889.28 343.63 No £86.03 -3.1% -4.3%
October 2023 Kenmare Resources PLC KMR 02/10/23 355.00 0.00% £4,128.93 £1,086.90 416.00 No £0.00 -14.7% -14.7%
November 2023 Pets at Home PLC PETS 06/11/23 270.00 1.52% £2,904.50 £0.00 299.00 No £44.26 -8.2% -9.7%
December 2023 Serco Group PLC SRP 04/12/23 186.40 0.00% £3,517.95 £677.78 158.76 No £0.00 17.4% 17.4%
January 2024 Avingtrans PLC AVG 08/01/24 387.50 0.00% £0.00 £2,335.92 392.00 No £0.00 -1.1% -1.1%
February 2024 Future PLC FUTR 05/02/24 697.00 0.00% £0.00 £1,494.79 716.12 No £0.00 -2.7% -2.7%
March 2024 Morgan Sindall Group PLC MGNS 04/03/24 2270.00 0.00% £1,446.59 £1,045.43 2307.43 No £0.00 -1.6% -1.6%

This is our portfolio tracking table, which we will update every month on this page. 

If you haven't already, you can download the 'smart' version of this table on which you can fill out and track your own returns, click the button below. 

All you need to do is copy the row for this month's pick and paste it into your table. Then enter your own values in the cells: 

Amount Re-invested (which will be 0 for the first year) 
Regular Monthly Investment (the amount you have invested in £)
Purchase Price (the cost of 1 share of the stock you have bought in pence)

The rest of the table will be taken care of by our 'smart' formulae

Download Smart Returns Tracker