Kier Group (LON:KIE): Building Momentum in Infrastructure?
Each month we highlight a stock that we believe offers an attractive investment case. This time, we’re looking at Kier Group (KIE) — one of the UK’s largest contractors, which has just delivered full-year results showing growth, improved cash generation, and a record order book. After a strong run in the share price, is there still upside left?
How Does Kier Make Money?
Kier is not just a traditional construction firm. It operates across three main segments:
- Infrastructure Services – Designs, builds and maintains major infrastructure, from highways and rail to ports, aviation and energy projects. Customers include National Highways, Network Rail, Transport for London, HS2 and regulated water utilities. This is Kier’s biggest division, providing long-term contracts and predictable revenue streams.
- Construction – Regional building projects and strategic government work, including education, custodial facilities and healthcare. Kier reports that the “average” order size is around £20m, helping spread project risk, though it also wins contracts in the £100m+ range.
- Property – A smaller but distinctive division, investing in and developing mixed-use commercial and residential property. After recapitalisation, Kier is targeting a 15% return on capital employed in this segment by FY28.
With a £11bn order book covering work years into the future, Kier has multiple sources of income and a pipeline of opportunities across both public and private sectors.
Why Do We Believe They’re Attractive?
Kier’s FY25 results showed steady growth and improved financial strength:
- Growing Profits: Adjusted pre-tax profit rose 6% to £125.4m, with operating margins nudging up to 3.9%.
- Cash Generation: Average month-end net debt fell to £49m (from £116m), while reported free cash flow came in at £155m. Even using stricter definitions, underlying free cash flow was healthy at around £86m.
- Record Order Book: £11bn of contracted work, securing 91% of FY26 revenue and around 70% of FY27 already.
- Shareholder-Friendly: Dividend lifted 38% to 7.2p (yield c.3.5%), plus a £20m share buyback launched in January.
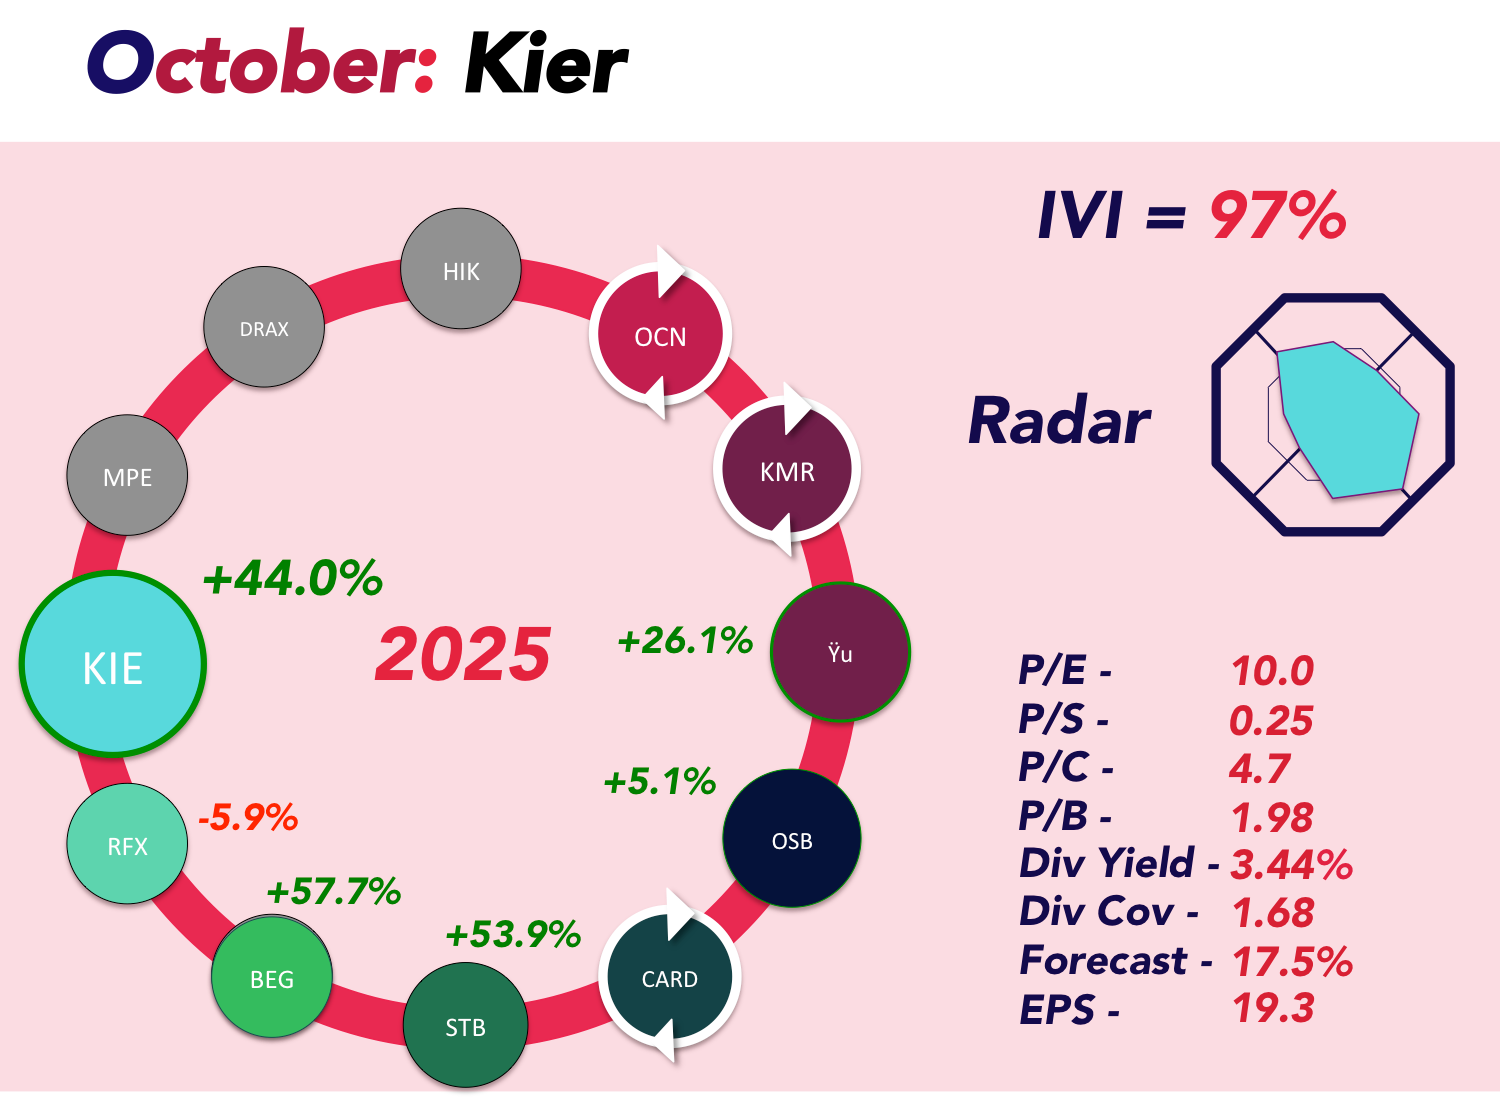
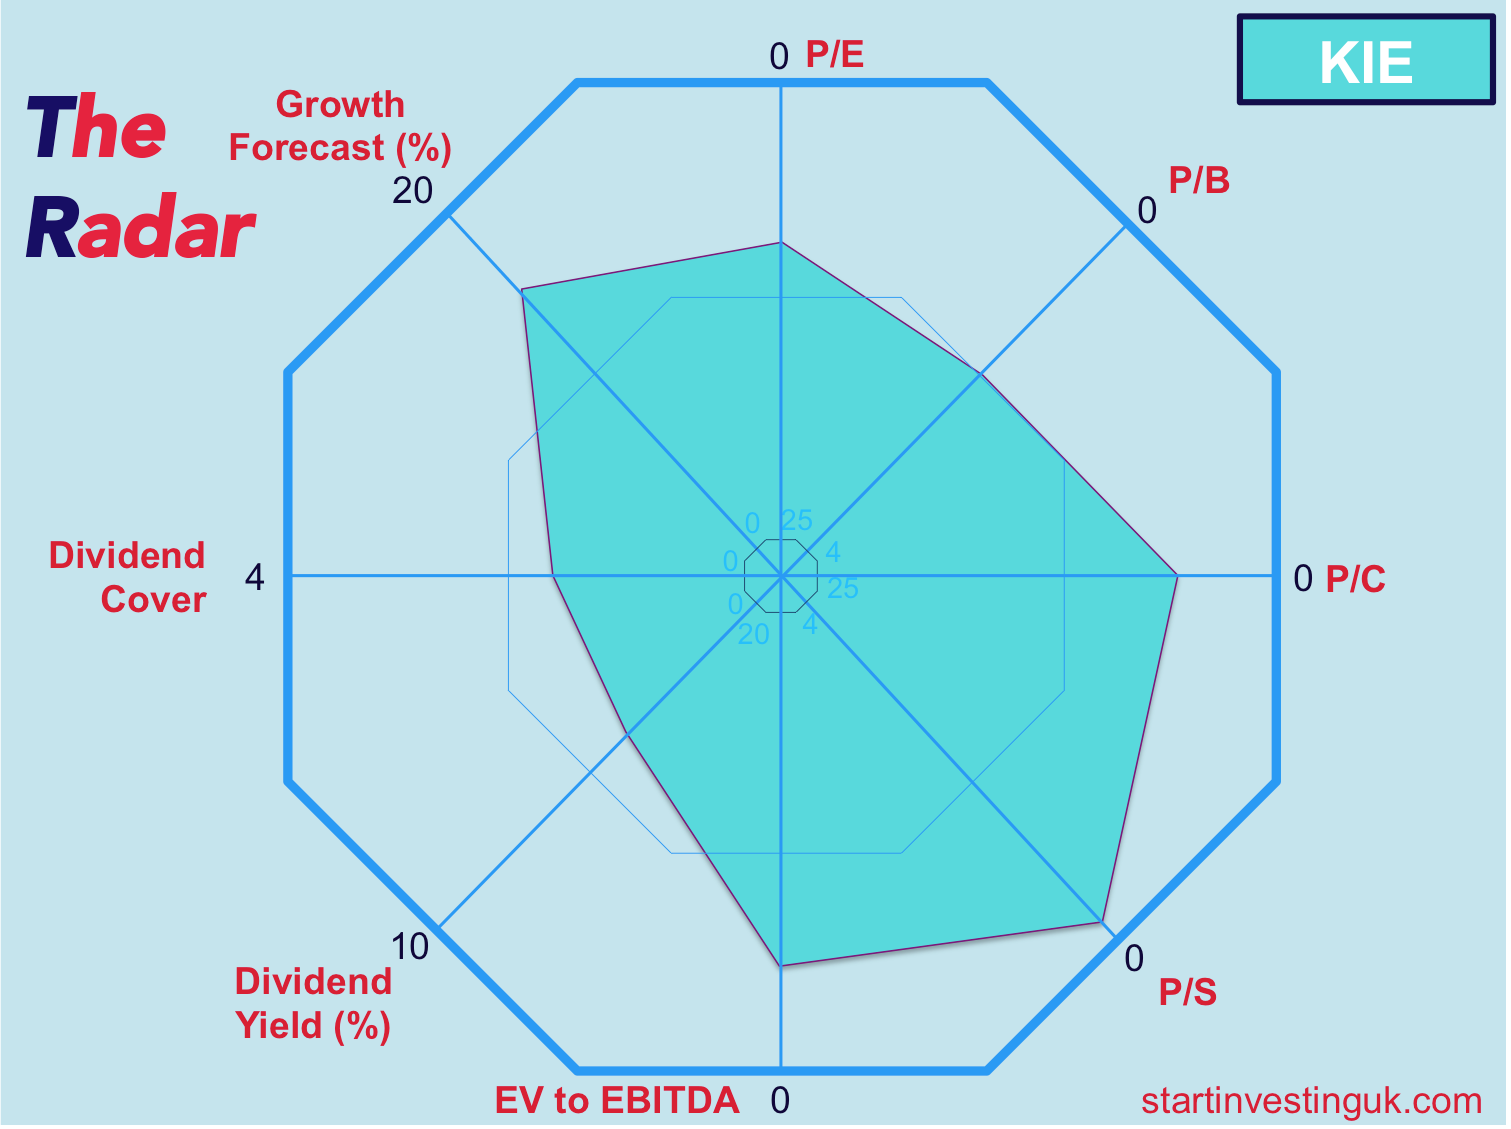
- Valuation: At 202p, Kier trades on a P/E of roughly 9x with a 3.8% yield — modest for a business showing improving margins and reduced debt reliance.
Put simply, Kier has demonstrated that its long-term turnaround plan is delivering results. The balance sheet is stronger, shareholder returns are rising, and management guidance has been upgraded for FY26.
What Are the Risks?
No construction company is without challenges, and Kier is no exception:
- Thin Margins: Operating margins remain under 4%, leaving little room for error if projects overrun.
- Cash Flow Transparency: Kier’s working capital movements and payables position make it tricky to judge how much underlying debt risk has really fallen.
- Project Risk: While management highlights an “average order size” of £20m, large contracts still expose Kier to significant project-specific risk.
- Sector Headwinds: Construction and infrastructure are cyclical and heavily dependent on government spending priorities. A slowdown in infrastructure investment would hit revenues hard.
Summary
Kier has come a long way under its turnaround plan, delivering stronger profits, rising shareholder returns and a record order book that stretches years into the future. At today’s valuation, the shares still look reasonably priced for the progress being made. While risks remain part and parcel of the sector, Kier’s momentum and visibility give cause for optimism.
We will be adding it to our portfolio on Monday.