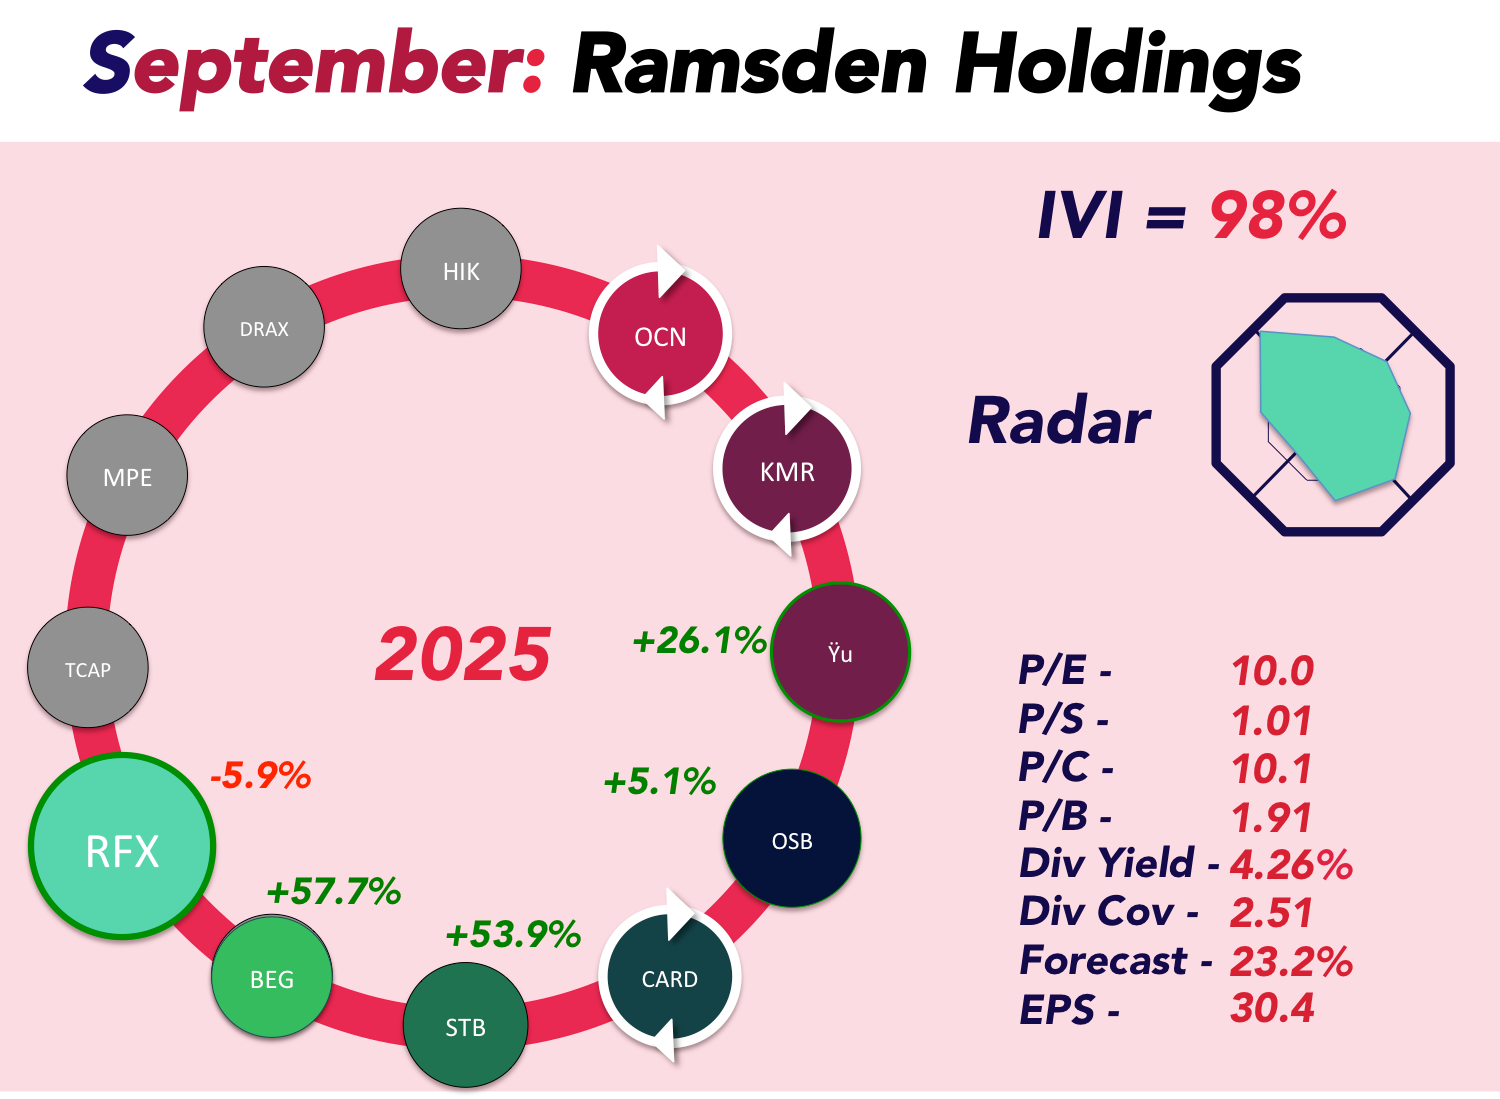
Ramsdens Holdings (LON:RFX): A Golden Opportunity?
Each month we highlight a stock that we believe offers an attractive investment case. This time, we’re looking at Ramsdens Holdings (RFX) — a business that has quietly delivered record results and could still be undervalued, despite a strong share price run.
How Do Ramsdens Make Money?
Ramsdens is not just your local pawnbroker. It’s a diversified financial services and retail business operating across four main areas:
- Purchase of Precious Metals – Ramsdens buys gold, silver, and other unwanted jewellery from customers. With gold at record highs, this side of the business is booming.
- Jewellery Retail – They sell new and pre-owned jewellery, including luxury watches. This provides steady revenue, particularly from customers looking for value compared to traditional jewellers.
- Pawnbroking – Short-term loans secured against jewellery and watches. About 90% of customers repay in full, and if they don’t, Ramsdens resells the goods through its other channels.
- Foreign Currency Exchange – Offering travel money services to holidaymakers. This division is smaller and more stable, though it hasn’t benefited from rising gold prices like the others.
With 169 stores across the UK plus growing online platforms, Ramsdens has multiple ways to generate cash and spread risk across its operations.
Why Do We Believe They’re Undervalued?
Ramsdens recently reported record half-year results, with profits up 54% to £6.1m. Full-year profits are expected to exceed £15m — a 31% increase on last year. This growth has been powered by the surge in gold prices, but also by good management and diversification.
- Strong Balance Sheet: £7.4m in net cash, giving them flexibility and resilience.
- Shareholder-Friendly: Dividends are rising — up 25% this half-year to 4.5p, plus a 0.5p special. That puts the yield at around 4.3%. More special payouts could follow if gold stays high.
- ·Expansion Ahead: Three new stores are already signed off, with more planned. Longer term, Ramsdens aims to open six to eight stores per year. Online growth is also gathering momentum with new dedicated websites.
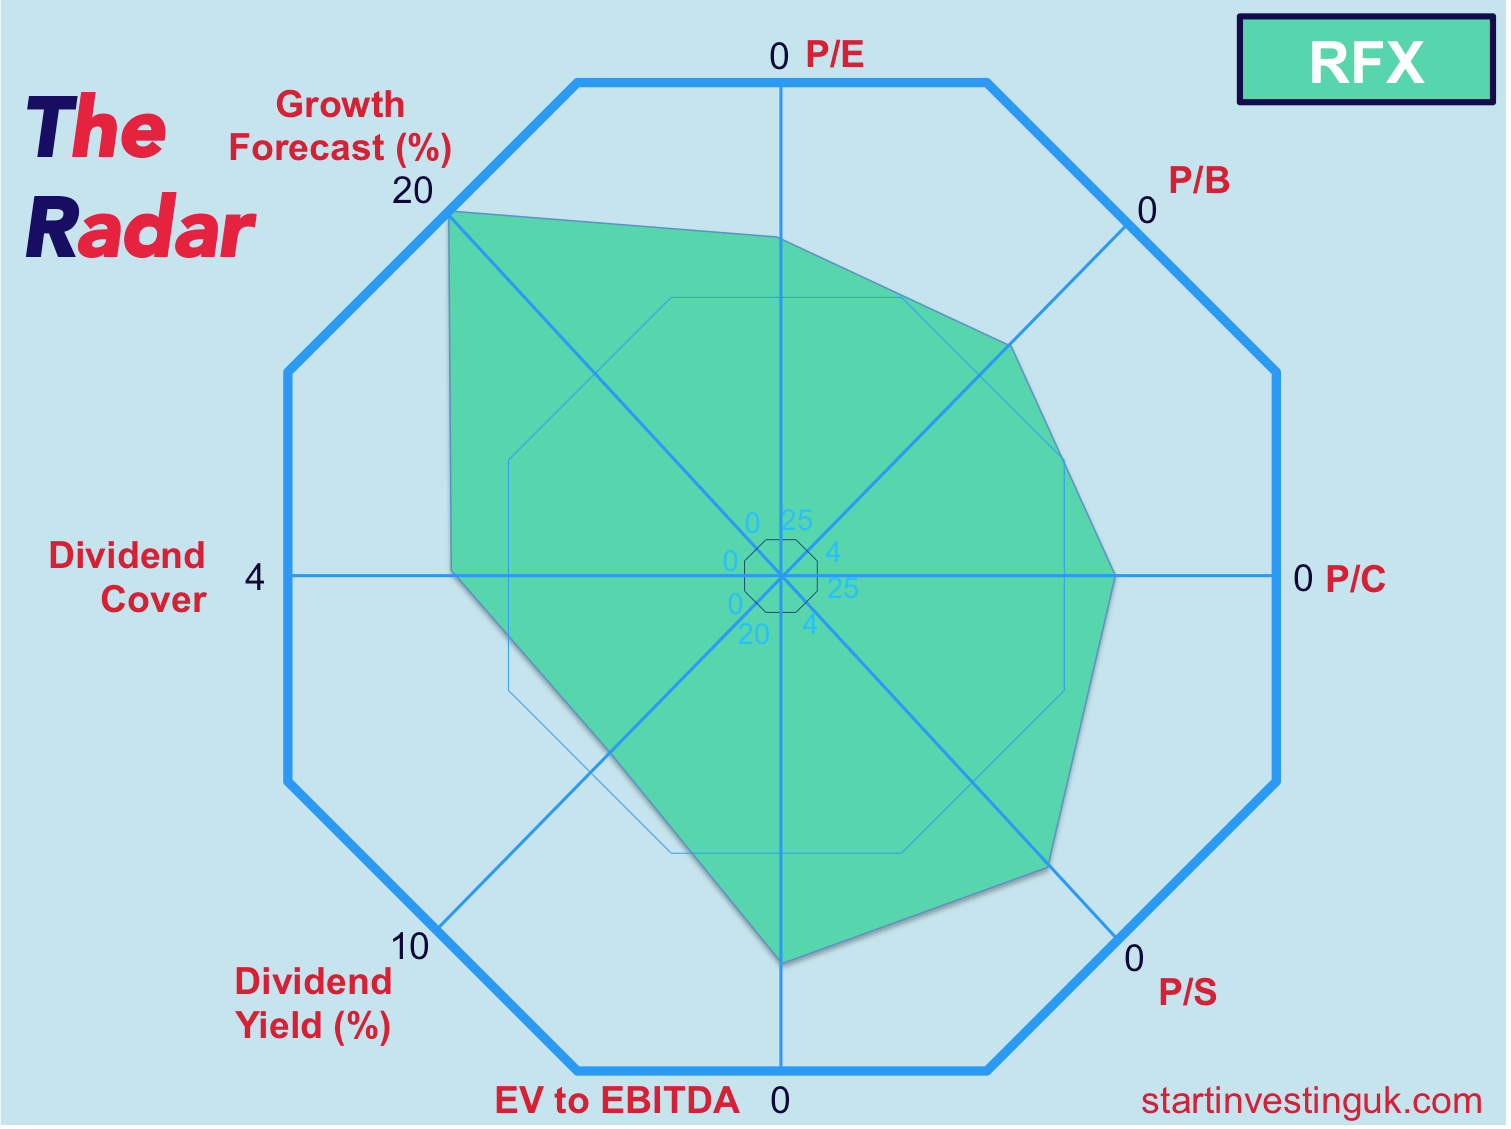
- Reasonable Valuation: At around 351p per share, the company trades on roughly 11x earnings — not expensive given the growth trajectory. Broker Panmure Liberum has raised its price target to 385p, but if gold keeps rising, that could prove conservative.
What Are the Risks?
No investment is without risk, and with Ramsdens, the big one is obvious: gold prices.
- If gold falls sharply, profits from jewellery buying and pawnbroking could be hit hard. The company has safeguards (like conservative loan-to-value ratios), but it remains more exposed to gold than its peer, H&T Group.
- A reminder from history: Albemarle & Bond, another pawnbroker, went bust in 2013 partly due to overreliance on gold. Ramsdens is better diversified and financially stronger, but the lesson stands.
- Rising Costs: Higher national insurance contributions and wage increases will eat into profits. Management expects an £800,000 annual hit from employment costs.
- Economic Sensitivity: Pawnbroking and jewellery sales can be influenced by wider consumer confidence.
In short, Ramsdens’ strong performance is partly thanks to gold’s rally. If the metal’s price slips, profits could soften.
Summary
Ramsdens Holdings offers investors a well-managed, cash-generative business with multiple growth levers. Yes, it’s riding the wave of high gold prices, but it also has:
- A growing store estate and online presence,
- A strong balance sheet,
- Rising dividends, and
- Management that balances reinvestment with shareholder returns.
At an 11x PE and a 4.3% yield, the stock still looks attractive — even after a 50% rise this year. If gold keeps climbing, Ramsdens will continue to shine. And even if it doesn’t, this is still a solid, diversified financial services group with plenty of runway for growth.
We will be adding it to our portfolio on Monday.